Supply Chain Analysis: Data Analysis Case Study Using Excel
A Supply Chain Analysis Project using Microsoft Excel and Microsoft Power BI.
Supply chain analytics plays a crucial role in driving data-driven decision-making across industries, including manufacturing, retail, healthcare, and logistics. In this report, I presented an analysis of a Fashion and Beauty startup’s supply chain data, specifically focused on the movement of makeup products. By collecting, analyzing, and interpreting this dataset, I aim to gain insights that can inform strategic decisions and optimize supply chain operations.

Dataset Overview
The dataset comprises various features related to the fashion and makeup product supply chain. These features provide valuable information for understanding the flow of products from suppliers to customers. The following features include:
Product Type
SKU
Price
Availability
Number of products sold
Revenue generated
Customer demographics
Stock levels
Lead times
Order quantities
Shipping times
Shipping carriers
Shipping costs
Supplier name
Location
Lead time
Production volumes
Manufacturing lead time
Manufacturing costs
Inspection results
Defect rates
Transportation modes
Routes
Costs
Supply Chain Analysis using Excel
The supply chain represents a network of interconnected processes involved in the production and delivery of goods to customers. Analyzing the various components of a supply chain is crucial for identifying opportunities to enhance its effectiveness and generate greater value for customers. In this report, I conducted a supply chain analysis using Excel and gave valuable insights into optimizing supply chain operations.
Dataset Source
To perform a supply chain analysis on this company, it is crucial to gather data related to various stages of the supply chain. This includes information on sourcing, manufacturing, transportation, inventory management, sales, and customer demographics.
Fortunately, I have come across this excellent dataset that provides comprehensive data about the supply chain of a Fashion and Beauty startup.
In the following section, I will guide you through the process I use to conduct a supply chain analysis using Excel.
Dataset Analysis using Excel
The first step is to import the file into Excel.
After importing the file, the next task is to remove any duplicate entries. To do this, I selected all the data by clicking on cell A1 and then pressed Ctrl+A. Then click on the “Data” tab and choose “Remove Duplicates” under the “Data Tools” section. Once duplicates are removed, the next step is to filter the data to identify any spelling errors or unwanted names. To do this, I can click on the “Filter” tool under the “Sort & Filter” section. While filtering, I noticed that some entries under the “Customer Demographics” category are labelled as “Unknown” instead of specific demographics like Male, Female or Non-Binary. Since I won’t be using this data, I proceeded with the existing information. At this stage, the data cleaning process is considered complete, and I have moved on to the next steps.
To facilitate further analysis, I converted the data into a table. I achieved this by selecting the entire data range (Ctrl+A) and then pressing Ctrl+T to convert it into a table. The next step is to create a pivot table. Navigated to the “Insert” tab and select the “PivotTable” tool. Choose the location for the pivot table (such as a new worksheet) and specify the data range (Table 1 or the relevant table name). Once the pivot table was created, I formatted the numbers to display as whole numbers and removed any decimal places for better readability.
A. Now, I’m ready to analyze the data and provide insights based on the following requirements or objectives.
I begin the analysis of the Supply Chain by examining the correlation between product prices and the corresponding revenue they generate.
Therefore, the company generates a higher revenue from skincare products, and there is a positive relationship between the price of skincare products and the revenue they generate.
B. Now, I examined the sales based on different product types.
Skincare products account for 45% of the company’s business, while haircare products contribute to 29.5% of the revenue, and cosmetics make up 25.5% of the total sales.
C. Now, I analyzed the total revenue generated from shipping carriers.
The company utilizes three shipping carriers for transportation, and among them, Carrier B contributes significantly to the company’s revenue generation.
D. Now, I examined the average lead time and average manufacturing costs for all products of the company.
Analyzing SKUs
In the dataset, there is a column labelled SKUs, which stands for Stock Keeping Units. SKUs are unique codes assigned to products to facilitate inventory management and tracking. They serve as a means to identify and differentiate individual items, ensuring accurate monitoring of stock levels. For instance, in a toy store with a diverse range of toys, each toy would be assigned a unique SKU as a secret number known only to the store, enabling efficient inventory control.
A. Now, I analyzed the revenue generated by each SKU.
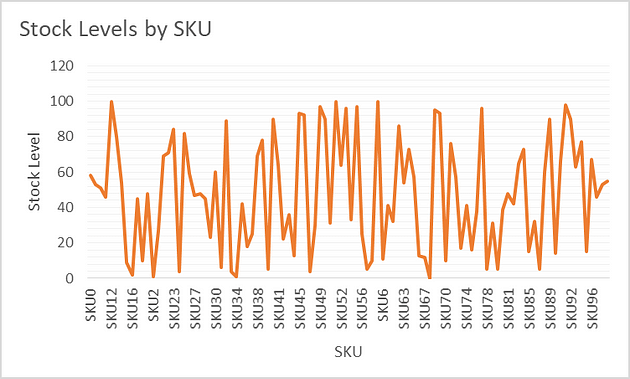
Another column in the dataset is labelled Stock levels. Stock levels indicate the quantity of products available in a store or business’s inventory at a given time
B. Now, I examined the stock levels of each SKU.
C. Now, I analyzed the order quantity of each SKU.
Cost Analysis
A. Now, I analyzed the shipping costs associated with different carriers.
The above visualizations revealed that Carrier B contributes significantly to the company’s revenue. However, it is also the most expensive carrier among the three options.
B. Now, I examined the distribution of costs by transportation mode.
The company allocates a larger portion of its transportation expenses to the Road and Rail modes for the transportation of goods.
Analyzing Defect Rate
The defect rate in the supply chain refers to the percentage of products that are found to have issues or are damaged after being shipped.
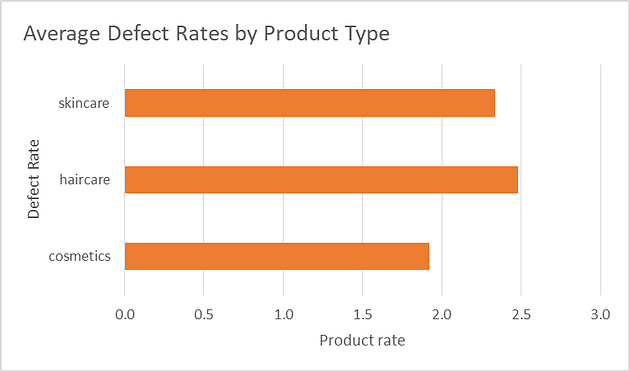
A. Now, I analyzed the average defect rate across all product types.
Haircare products have a higher defect rate compared to other product types.
B. Now, I examined the defect rates based on the mode of transportation.
Road transportation exhibits a higher defect rate, while Air transportation demonstrates the lowest defect rate. This showcases how Excel programming language can be utilized to analyze a company’s supply chain.
Dashboard
I successfully created a dashboard using Power BI that presents the insights mentioned earlier. The dashboard effectively highlights essential revenue-related information, including:
1. Revenue generated from each supplier.
2. Revenue generated from each location.
3. Revenue generated from each company product.
4. Total products delivered by each carrier.
These insightful visualizations offer valuable data-driven perspectives, enabling informed decision-making and strategic planning.
Summary
Supply Chain Analysis involves examining different aspects of a supply chain to identify areas for improvement and enhance the overall efficiency of the supply chain, ultimately delivering greater value to customers. This report provided an overview of conducting a supply chain analysis using Excel, highlighting key steps and techniques and revenue generated.
Thank you for reading, for more guides like this follow me on;
Buy Me a Coffee
If you find this article insightful you can support me by buying me a coffee (Click HERE).
Remember to like, share, comment and subscribe.


