


Maximizing Growth and Loyalty: The Power of Customer Lifetime Value Analysis
A Customer Lifetime Value Analysis Project using Python.

Customers form the beating heart of every business, driving its growth and evolution. Beyond being mere transactions, they are living entities with desires, needs, and dreams. Each customer holds the potential for a relationship that extends far beyond a single purchase.
In this article, I will take you through the task of Customer Lifetime Value Analysis using Python.

Introduction
Customer lifetime value analysis is a crucial method used to calculate the total worth of customers to a business throughout their entire relationship with the company. It provides valuable insights for determining optimal investments in customer acquisition and retention strategies. Additionally, it aids in identifying the most valuable customers, allowing businesses to prioritize and focus their efforts on retaining these high-value customers. This strategic analysis ultimately contributes to sustainable growth and improved customer relationships.
For this project, I delve into the essence of customer lifetime value. My analysis delves deep, comparing the cost of acquiring customers with the revenue they bring. Furthermore, I explored the effectiveness of diverse marketing channels and campaigns in attracting high-value customers.
A customer is not just a point on a sales graph, but a story waiting to be told.
Importing Essential Python Libraries and Datasets
In this section, I imported vital Python libraries and the dataset that will serve as the bedrock of my Customer Lifetime Value Analysis. This initial groundwork is crucial as it sets the stage for the insightful exploration that lies ahead.
import pandas as pd
import numpy as nd
import matplotlib.pyplot as plt

data = pd.read_csv(r"xxxxxxxxxxxxxxxxxxxxxxxxxxxxxxxxx.csv")
data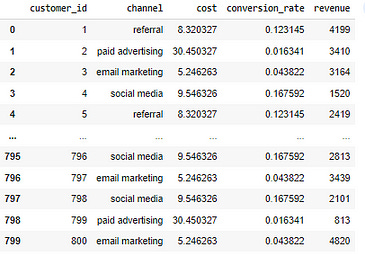
Data Exploration
In order to comprehend the dataset I’m handling, I engage in data exploration. This involves identifying patterns, comprehending interrelationships among columns, and detecting potential outliers. This preliminary analysis helps unveil insights and provides a foundational understanding of the data’s structure.
My initial step in exploration involved generating a statistical summary of the dataset.
#Get summary statistics
print(data.describe())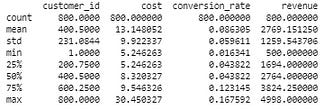
After that, I proceeded to examine the data to figure out what type of information is stored in each column.
# Check the data types of columns
print(data.info())
Next is to review the data to see if there are any unusual or exceptional values(Outliers) that stand out.
Before that, I need to make the customer_id the index column.
# making the customer_id column the index column
data.set_index('customer_id', inplace=True)
data
# Checking for Outliers
data.boxplot()
This shows that there are equal distributions of values in my data and I can proceed to use this for analysis.
Data Analysis and Visualization
I started by visualizing the distribution of acquisition costs and revenue generated by the customer using histograms.
# Distribution of acquisition costs by customer

plt.hist(data['cost'], bins=10, edgecolor='black', alpha=0.7, color='orange')  # Set the color to blue
plt.title("Distribution of Acquisition Cost")
plt.xlabel("Cost")
plt.ylabel("Count")
plt.show()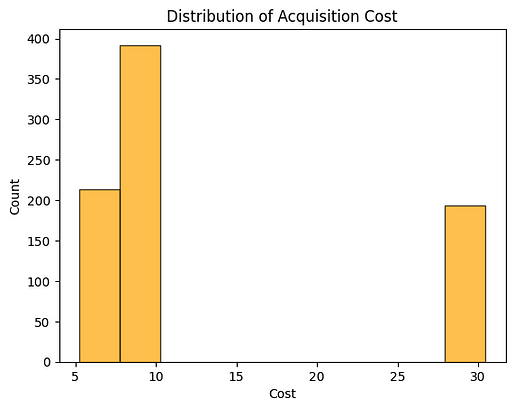
# Revenue generated by customer

plt.hist(data['revenue'], bins=10, edgecolor='black', alpha=0.7, color='orange')
plt.title("Distribution of Revenue")
plt.xlabel("Revenue")
plt.ylabel("Count")
plt.show()
Next, I compared the cost of acquisition across different channels and identified the most and least profitable channels.
# Customer Acquisition Cost by Channel

cost_by_channel = data.groupby('channel')['cost'].mean().reset_index()

plt.bar(cost_by_channel['channel'], cost_by_channel['cost'], color='orange')
plt.title("Customer Acquisition Cost by Channel")
plt.xlabel("Channel")
plt.ylabel("Cost")
plt.show()
The data reveals that paid advertising stands out as the most costly channel, while email marketing emerges as the least expensive option.
Next, let’s see which channels are most and least effective at converting customers
# Conversion Rate by Channel

conversion_by_channel = data.groupby('channel')['conversion_rate'].mean().reset_index()

plt.plot(conversion_by_channel['channel'], conversion_by_channel['conversion_rate'], marker='o', color='orange')
plt.title("Conversion Rate by Channel")
plt.xlabel("Channel")
plt.ylabel("Conversion Rate")
plt.show()
From the analysis, it’s apparent that social media proves to be the most proficient channel for customer conversion, whereas paid advertising appears to be the least productive in this regard.
Next, I calculated the total revenue by channel and had a look at the most and least profitable channels in terms of generating revenue.
# Total Revenue by Channel

revenue_by_channel = data.groupby('channel')['revenue'].sum().reset_index()

colors = ['yellow','orange', 'purple', 'pink',]

plt.pie(revenue_by_channel['revenue'], labels=revenue_by_channel['channel'], autopct='%1.1f%%', colors=colors)
plt.title("Total Revenue by Channel")
plt.axis('equal')
plt.show()
So email marketing is the most profitable channel in terms of generating revenue. But there’s not a huge difference between the percentages of revenue generation from all the channels to call any channel the least profitable channel.
Now let’s calculate the return on investment (ROI) for each channel.
Before I proceed with calculating the return on investment (ROI) for each channel, I updated the data frame with the ROI column
#Update the Dataframe with ROI colunmn

data['roi'] = data['revenue'] / data['cost']
data.head()
# Return on Investment (ROI) by Channel

roi_by_channel = data.groupby('channel')['roi'].mean().reset_index()

plt.bar(roi_by_channel['channel'], roi_by_channel['roi'], color='orange')
plt.title("Return on Investment (ROI) by Channel")
plt.xlabel("Channel")
plt.ylabel("Roi")
plt.show()
The ROI from email marketing is way higher than all other channels, while the ROI from paid advertising is the lowest. Now let’s calculate the customer lifetime value from each channel.
Calculating the Customer's Lifetime Value
Based on the data that I have, I calculated the Customer Life Time Value (CLTV) using;
CLTV = (revenue — cost) * conversion_rate / cost
Before proceeding with my calculation, I updated my Dataframe with the CLTV column.
#Update the Dataframe with CLTV colunmn

data['cltv'] = (data['revenue'] - data['cost']) * data['conversion_rate'] / data['cost']
# Customer Lifetime Value by Channel

channel_cltv = data.groupby('channel')['cltv'].mean().reset_index()

plt.bar(channel_cltv['channel'], channel_cltv['cltv'], color='orange')
plt.title("Customer Lifetime Value by Channel")
plt.xlabel("Channel")
plt.ylabel("cltv")
plt.show()
The customer lifetime value is notably highest for the Social Media and referral channels.
Now let’s compare the CLTV distributions of social media and referral channels using the box plot.
# CLTV Distribution by Channel

subset = data.loc[data['channel'].isin(['social media', 'referral'])]

plt.figure(figsize=(8, 6))

boxplot_colors = ['orange', 'pink']

bp = plt.boxplot([
    subset.loc[subset['channel'] == 'social media']['cltv'],
    subset.loc[subset['channel'] == 'referral']['cltv']
], labels=['Social Media', 'Referral'], patch_artist=True)

for box, color in zip(bp['boxes'], boxplot_colors):
    box.set(facecolor=color)

for whisker in bp['whiskers']:
    whisker.set(color='black', linewidth=1.5)

for median in bp['medians']:
    median.set(color='black', linewidth=2)

plt.title('CLTV Distribution by Channel')
plt.ylabel('CLTV')
plt.xlabel('Channels')
plt.grid(True)
plt.show()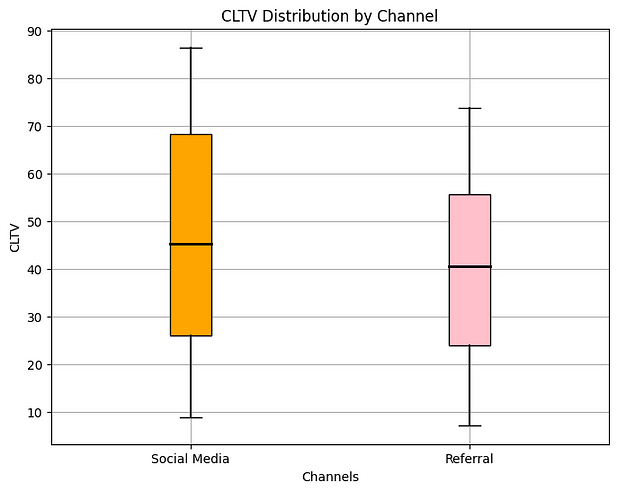
While the variance is minimal, the Customer Lifetime Value derived from the Social Media channel marginally surpasses that of the referral channel.
Summary
Customer lifetime value analysis serves the purpose of approximating the overall value that customers bring to a business throughout the entirety of their engagement. This analytical tool aids companies in making informed decisions regarding investments in customer acquisition and retention strategies. Additionally, it aids in pinpointing the most valuable customers, enabling focused retention endeavours.
I trust you found this article on Customer Lifetime Value Analysis utilizing Python insightful.
Thank you for reading, for more guides like this follow me on;
Buy Me a Coffee
If you find this article insightful you can support me by buying me a coffee (Click HERE).
Remember to like, share, comment and subscribe.