

Data Insights with Boxplots: A Comprehensive Guide
Exploring the Features and Applications of Box-and-Whisker Plots for Data Analysis


I've been working with data for a while, and one of the tools that has proven incredibly useful in understanding the distribution of data is the boxplot. In this brief guide, I'll share some insights into the features of a boxplot and how it can help us make sense of our data.
What is a Boxplot?
A Boxplot is a graphical representation of data that shows the distribution, spread, and central tendency of a dataset. It's a great tool for understanding the "shape" of your data. Boxplots, also known as box-and-whisker plots, are one of my favorite tools for visualizing and understanding the distribution of data.
Attribute 1: Median
The median is the middle value of your data when it's sorted. It's represented by a line inside the box. The median tells you where the "centre" of your data is.
Attribute 2: Quartiles
A boxplot has two quartiles: Q1 (25th percentile) and Q3 (75th percentile). These are the edges of the box. They show the spread of your data in the lower and upper halves.
Attribute 3: Whiskers
The "whiskers" are the lines extending from the box. They show the range of your data. Anything outside the whiskers might be considered an outlier
Attribute 4: Outliers
Outliers are data points that fall far from the box and whiskers. They can be important to identify because they might indicate errors or interesting patterns in your data.
Symmetry or Skewness in Box Plot

Box plots can help us see if data is balanced or not. If the middle line in the box isn't in the middle, it means the data is leaning more towards one side. This can tell us if the data isn't evenly spread out, which is useful for finding differences in how the data is distributed.
Comparability
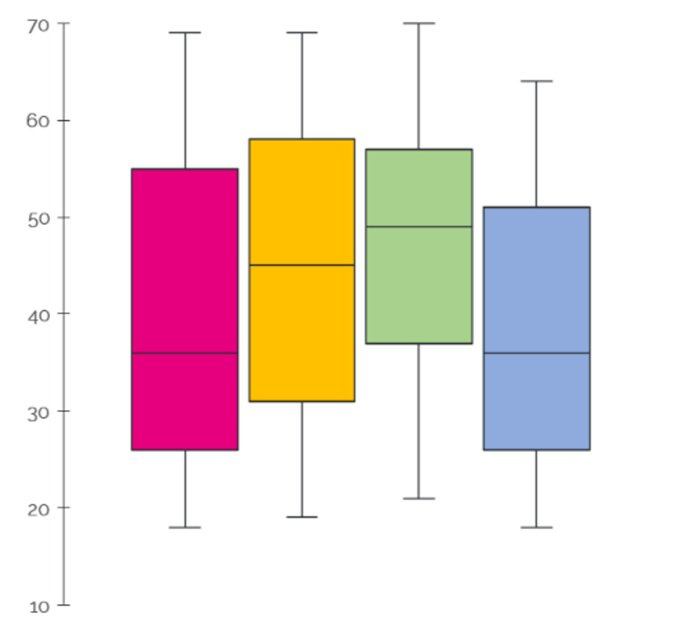
Box plots are handy for comparing different sets of data. You can put them next to each other to see how they're different in terms of middle values, how spread out they are, and if there are any unusual points. This helps a lot when you're trying to understand your data better.
Boxplots are a versatile and insightful tool for exploring the characteristics of our data quickly. They help us identify the central tendency, spread, and potential outliers, making them a valuable addition to any data analyst's toolkit. Whether you're analyzing sales data, survey responses, or any other dataset, understanding the features of a boxplot can guide your insights and decision-making.
Your support is invaluable
Did you like this article? Then please leave a share or even a comment, it would mean the world to me!
Don’t forget to subscribe to my YouTube account HERE, Where you will get a video explaining this article!